Decennial Census
What Is It?
The decennial census is conducted by the U.S. Census Bureau every 10 years to provide a full count of the U.S. population and gather basic information on population, households, and housing characteristics.
The main purpose of the decennial census is to allocate the seats in the U.S. House of Representatives and provide data for state and local legislative redistricting. The decennial census also gives communities the most definitive information about the size of their population and its basic demographic characteristics. Census data are used in distributing federal funding to communities and in informing governmental, nonprofit, and business decisions on many matters.
What Subjects are Covered
The Census Bureau collects decennial census information from a “short form” questionnaire mailed to all households every 10 years.
Key subjects include:
- Counts of population, households, and housing units
- Basic demographics (age, sex, race, and Hispanic or Latino origin)
- Whether people live in households or group quarters
- Household size and composition
- Housing occupancy and tenure (owner- or renter-occupied)
What Is Published
The Census Bureau currently has decennial census data for the 2000 and 2010 censuses posted on their main data portal, data.census.gov. New data from the 2020 Census will soon be posted to this portal.
The City of Seattle has provided population and housing information curated from the 1990, 2000, 2010, and 2020 censuses for the city and its neighborhoods.
The information available includes:
- Reports and tables of basic demographic information
- Reference maps and geographic data files including GIS shapefiles
For more information about each census, please see the desired decade on the tabs along the top of this page.
Shift from the Decennial Census Long Form to the American Community Survey
In past decades, the decennial census also produced estimates on detailed demographic, social, economic, and housing characteristics collected as part of a nationwide sample using a questionnaire known as the "long form".
In 2010 and 2020, the Census Bureau only conducted the 100% count using a short questionnaire. The data that were previously collected by the "long form" are now gathered by the Bureau's American Community Survey (ACS).
Redistricting Data from the 2020 Census
On August 12, 2021, the U.S. Census Bureau released the 2020 Census Redistricting Data for states and local communities, which includes the statistics on the following topics:
- County
- Place (including city)
- Census tract
- Population totals
- Population by basic race categories & Hispanic/Latino origin and by broad age group (under 18, 18+)
- Housing unit counts and occupancy status
- Population in "group quarters," (for example, nursing homes and college dorms)
The initial release of the Redistricting Data was in a legacy technical format that requires analysts to do additional work to extract the data. The Bureau indicates it will release the data in easier to use formats by September 30, 2021.
Additional Resources
We are preparing resources to help people access and understand the 2020 Census data and the demographic changes these data indicate with key data for Seattle, our council districts; and city neighborhoods including urban centers and villages and community reporting areas.
As a start, we have posted tables with key data in Seattle GeoData, the City's mapping based open data portal.
Materials from past "I Love Census Data" sessions, including our August 2021 session focusing on the 2020 Census data and trends in King County and Seattle neighborhoods can be found here.
Basic Population and Housing Unit Characteristics
Resources from the Census Bureau
- 2020 Census Redistricting Data Release Press Kit and video recording of news conference. Includes key takeaways on population growth of counties and metropolitan areas, trends related to race, ethnicity, and diversity.
- What is Redistricting video
- Map Viewer for zooming into data at the state, county, and census tract levels. View this How to use video.
- Improvements to the Census Race and Hispanic Origin Questions and Measuring Racial and Ethnic Diversity
- 2020 Census Results webpage for more about the Redistricting Data
Important notes for 2020 Census data users: The Census Bureau used a new tool, called Differential Privacy, to inject statistical noise into the 2020 Census data. While helping protect privacy, the added noise reduces accuracy, particularly for geographies and groups of people with small populations. Combining data for census blocks and other small geographies improves accuracy. For tips on using the data, see the blog post by Bureau's acting director on "What to Expect" when looking at the 2020 Census results.
Additional resources
The Washington State Office of Financial Management (OFM):
- Redistricting Data in Excel and csv format for many different types of geographies in Washington, including but not limited to the state, counties, cities, Zip Code Tabulation Areas, tribal areas, Census Tracts, and block groups. Hint: click on "Redistricting Data (Public Law 94-171)" to choose files of interest.
- Information about 2020 Census data quality and accuracy, including coverage, impacts of new privacy protections, and more.
Puget Sound Regional Council:
King County:
Media:
- National Public Radio: Search for 2020 Census
Upcoming Census 2020 Data Releases
Following is a list of major upcoming data releases that will be coming from the Census Bureau and that will include information for local communities. See Releasing the Count (census.gov) for updates on these and other 2020 Census data products.
- Release of Redistricting Data in easier to use formats-By September 30, 2021
- Demographic Profiles-Streamlined, easy to use profiles with most commonly used topics. Subjects: sex, basic race categories, Hispanic/Latino ethnicity, sex, more detailed age groups, household composition, group quarters population, housing occupancy, and housing tenure (owner or renter occupied). Lowest level of geography: place (city).
- Demographic and Housing Characteristics File and tables-More data on many of the topics above, with some topics cross-tabulated by basic race categories and Hispanic/Latino origin. Some tables will include detailed neighborhood level geographies; however, due to new privacy protections, many tables will likely not be released at as detailed geographic levels as .
- Detailed Demographic and Housing Characteristics File -Data for detailed race and ethnicity groups including detailed American Indian and Alaska Native populations.
2010 Census
The 2010 decennial census was composed of the 100% count “short-form” sent to all households. Summary File 1 is the 100% data that corresponds to a limited number of questions asked of every person and housing unit in the United States. These included sex, age, household relationship, race and Hispanic origin, and ownership versus rental status.
In 2010 the Census Bureau did not conduct the sample or “long-form” to collect data on social and economic characteristics of the population, or physical and financial characteristics of housing units. The data that in the past was collected by the “long-form” is now part of the American Community Survey.
Demographic Highlights
Population Growth
The 2010 Census measured Seattle’s population at 608,660. This was an increase of about 56,000 persons, or 8 percent since the 2000 Census. While somewhat slower than the 9 percent population growth Seattle experienced in the 1990s, this was still a healthy rate of growth for a major U.S. city.
While Seattle did not grow as quickly as King County as a whole, Seattle remains, by far, the most populous city in the King County. Seattle is the 23rd most populous city in the nation, and is the hub of Seattle-Tacoma-Bellevue Metro Area, which is the 15th most populous metro area in the nation.
Race and Ethnicity
The 2010 Census results indicate that more than a third (34 percent) of Seattle residents are persons of color. This is up from 32 percent in 2000. The Census collects information on Hispanic / Latino ethnicity in a separate question from race. “Persons of color” encompass Hispanics and Latinos of any race as well as persons who are any race other than White alone.
The largest non-White racial group in Seattle is Asian (14 percent of the city’s population), followed by Black or African American (8 percent). Five percent of Seattle residents indicated two or more races on their Census form in 2010.
Seven percent of Seattle’s residents are of Hispanics or Latino ethnicity.
Race and ethnic groups that grew the most quickly in Seattle were Asians, persons who are two or more races, and persons of Hispanic or Latino ethnicity.
Selected Age Groups
Results from the 2010 Census indicate that children under 18 make up 15 percent of the city’s population. Between the 2000 Census and 2010 Census, the number of children in Seattle increased, but at a pace slightly slower than the overall population growth rate. However, the number of young children (under age 5) increased much more quickly.
Young adults between 18 and 34 years of age comprise one-third of Seattle’s population.
Seniors are 11 percent of Seattle’s population. The number of seniors in Seattle declined between 2000 and 2010, but may increase in the next decades as the cohort of baby boomers living in the city reach their senior years.
Households and Household Characteristics
The 2010 Census tallied 283,510 households in Seattle. This represents an increase of roughly 25,000 households, or 9.7 percent, since the 2000 Census. This is slightly higher than the 9.2 percent increase seen in the 1990s.
Between 2000 and 2010, the average number of persons per household in Seattle declined from 2.08 to 2.06. This slight decline continues a long term trend toward smaller household sizes, both locally and nationally.
About 13 percent of Seattle’s households are husband-wife married couples with children. Another 6 percent of Seattle households are other families with children. These figures on family households with children refer to households in which there is at least one child under 18 years of age who is related to the householder.
Husband-wife married couples without related children make up 19 percent of all households in Seattle. About 5 percent of households are other families without children.
One-person households comprise 41 percent of Seattle’s households. The increasing number of one-person households has been a key driver contributing to the city’s declining household size. Non-relatives living together comprise another 16 percent of the households in Seattle.
Housing
Number of Housing Units
The 2010 Census counted a total of 308,516 housing units in Seattle, for an increase of approximately 38,000 units — or 14 percent since the 2000 Census. This is substantially greater than the 8.6 percent growth in housing units seen in the 1990s.
Growth between 2000 and 2010 in Seattle’s housing stock far outpaced the 9.7 percent increase in the number of Seattle households that decade. At the same time, vacant housing units in Seattle more than doubled in number, from 12,025 in 2000 to 25,006 such units in 2010. The number of occupied housing units is equivalent to the number of households given that the Census Bureau defines households as a group of people who occupy a housing unit together.
Tenure: Owner-Occupied and Renter-Occupied Housing Units
In Seattle, renter-occupied housing units somewhat outnumber owner-occupied units: 51.9 percent are renter occupied and 48.1 percent are owner-occupied. The trend in recent decades has been one of gradually declining homeownership rates. The slight reduction in the homeownership rate from 48.4 percent in 2000 to 48.1 percent in 2010 continued this trend. Annual estimates from the Census Bureau’s American Community Survey indicate that the downward trend in homeownership rates was interrupted temporarily during the housing bubble that occurred in the later half the last decade. However, estimated homeownership rates in the city began to decline toward the end of the decade after the housing bubble burst.
Population in Group Quarters
In 2010, one in twenty Seattle residents lived in group quarters such as college or university student housing (with about 11,800 persons), nursing facilities (2,600 persons), and correctional facilities (2,000 persons).
Redistricting Data
Redistricting data (also referred to as Public Law 94-171) includes counts of the total population by race and ethnicity and the total population over age 18 years old. Information on occupied and vacant housing units is also included. Data is available at multiple geographic summary levels down to the block level.
- City of Seattle data profiles: Excel table with six profile tabs covering detailed race and ethnicity categories
- Seattle Basic Population and Housing Characteristics Change for 1990, 2000, and 2010: PDF report of counts of population by race, ethnicity, and over or under 18 years of age as well as a total, occupied, and vacant housing unit count for 1990, 2000, and 2010
- King County census blocks: zipped Excel file (requires Excel 2007 or above) of all redistricting data by census block in King County
- King County census tracts: Excel table with five profile tabs of all PL data by census tract in King County
General Demographic Data
Summary File 1 data tables provide the most detailed information available from the 2010 Census. Tables includes cross-tabulations of age, sex, households, families, relationship to householder, housing units, detailed race and Hispanic or Latino origin groups, and group quarters. Data is available at multiple geographic summary levels down to the block level.
- City of Seattle Census Bureau Demographic Data Profile
- Seattle 2010 Census Demographic Data Profile
- City of Seattle Subject Report of Population, Households, and Housing
- 2010 Census Profile City of Seattle
- City of Seattle Census Blocs 2010 Characteristics Report
Neighborhood Areas
To report census data for neighborhood areas, the City uses different combinations of census tracts, block groups and blocks to best approximate the various neighborhoods and sub-areas of the City. If the neighborhood-area boundaries split a block group or tract, the block group or tract was included if more than 50-percent of its population lived within the neighborhood area.
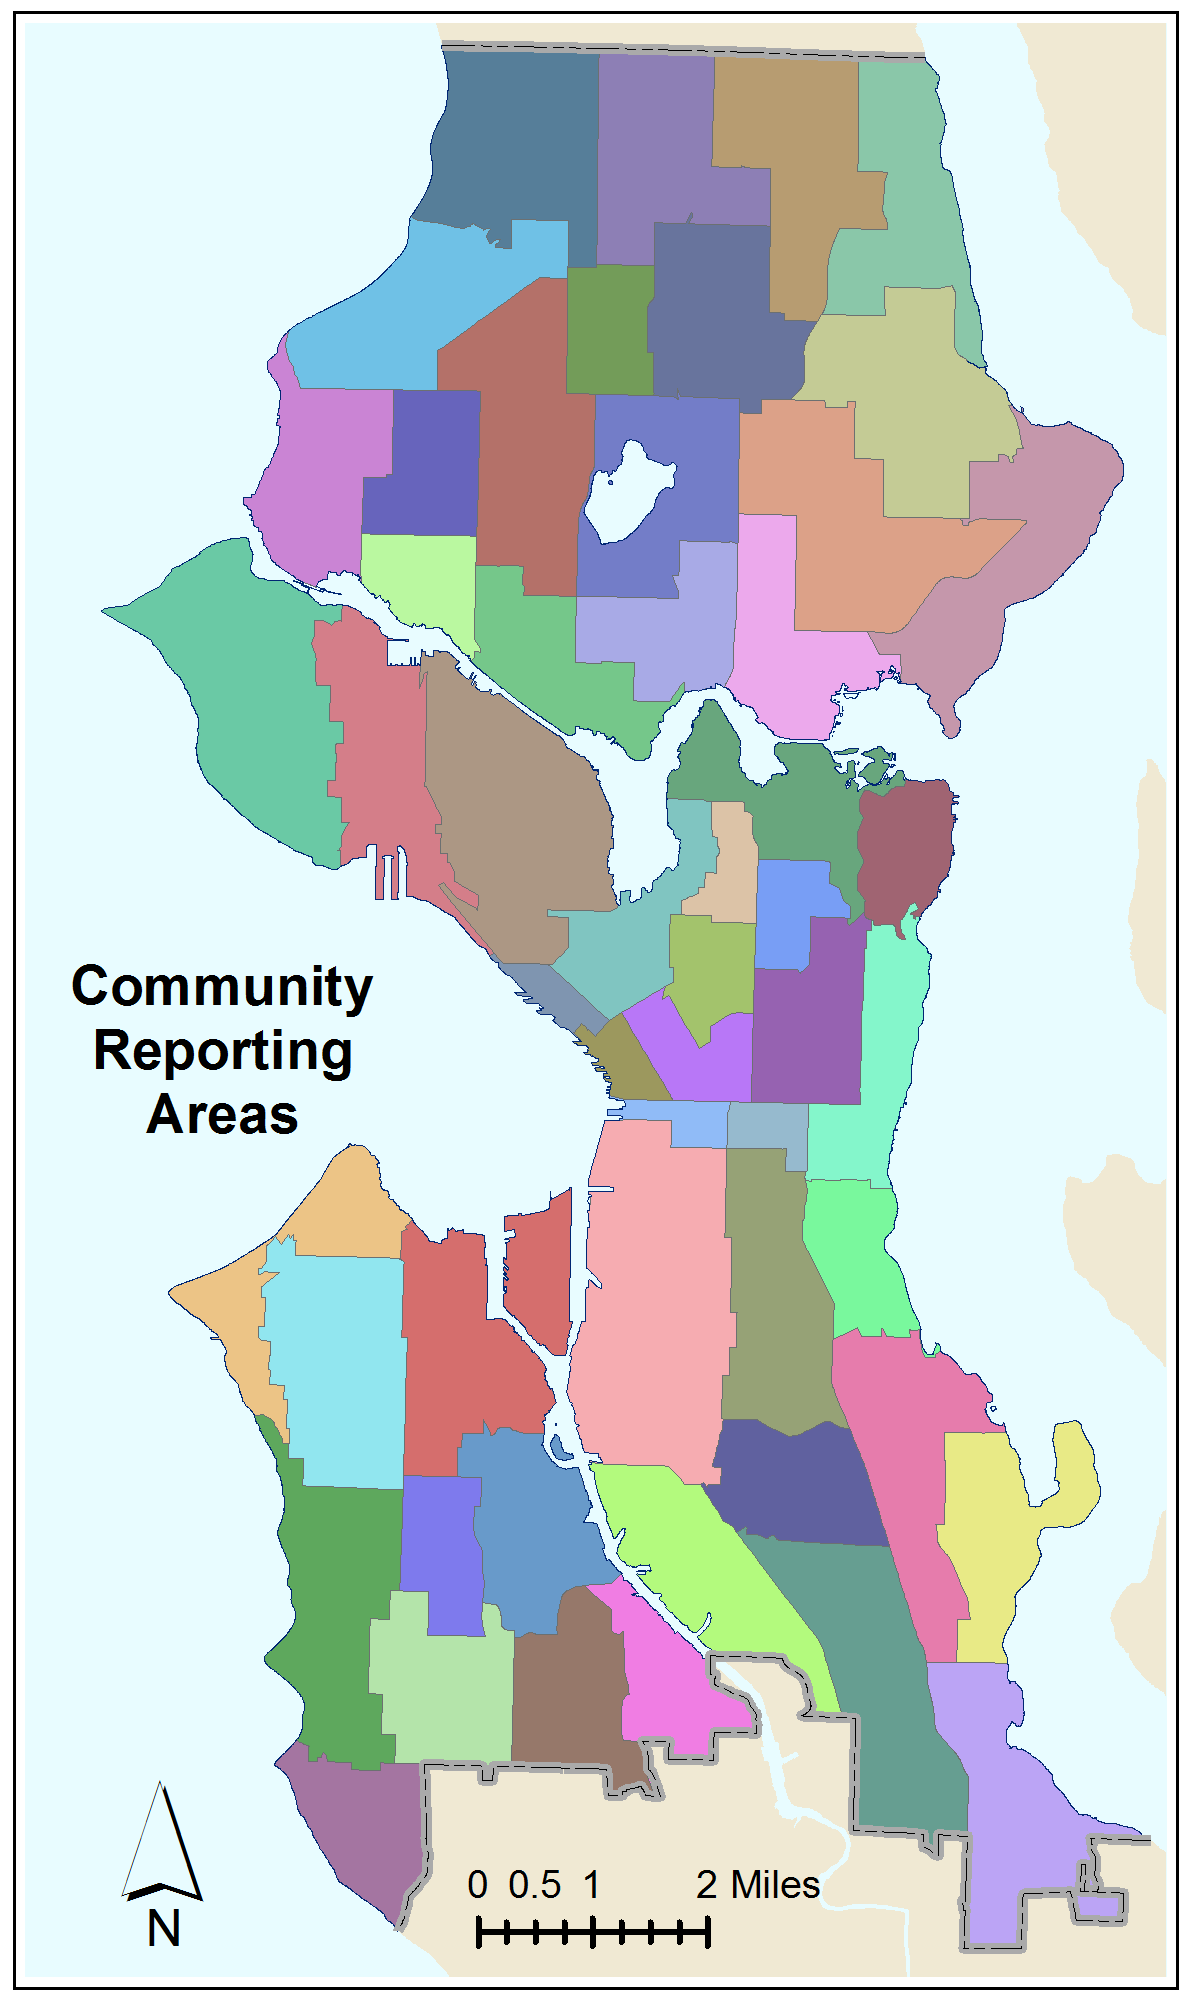
Community Reporting Areas
Community Reporting Areas (CRAs) were adopted in 2004 as a standard, consistent, citywide geography for reporting purposes. There are 53 CRAs derived from census tract geography.
- 2010 Census Seattle Community Reporting Areas and Census 2010 Tracts Reference Map
- Change from 1990-2010
- Community Reporting Areas 1990, 2000, 2010 Census Characteristics
- 2010 Census Community Reporting Areas Population Characteristics
- 2010 Census Community Reporting Areas Household Characteristics Households
- 2010 Census Community Reporting Areas Housing Characteristics Housing
- Census 2010 Community Reporting Areas Subject Report Subject report (Population, Households, Housing)
- Census 2010 Community Reporting Areas Subject Report
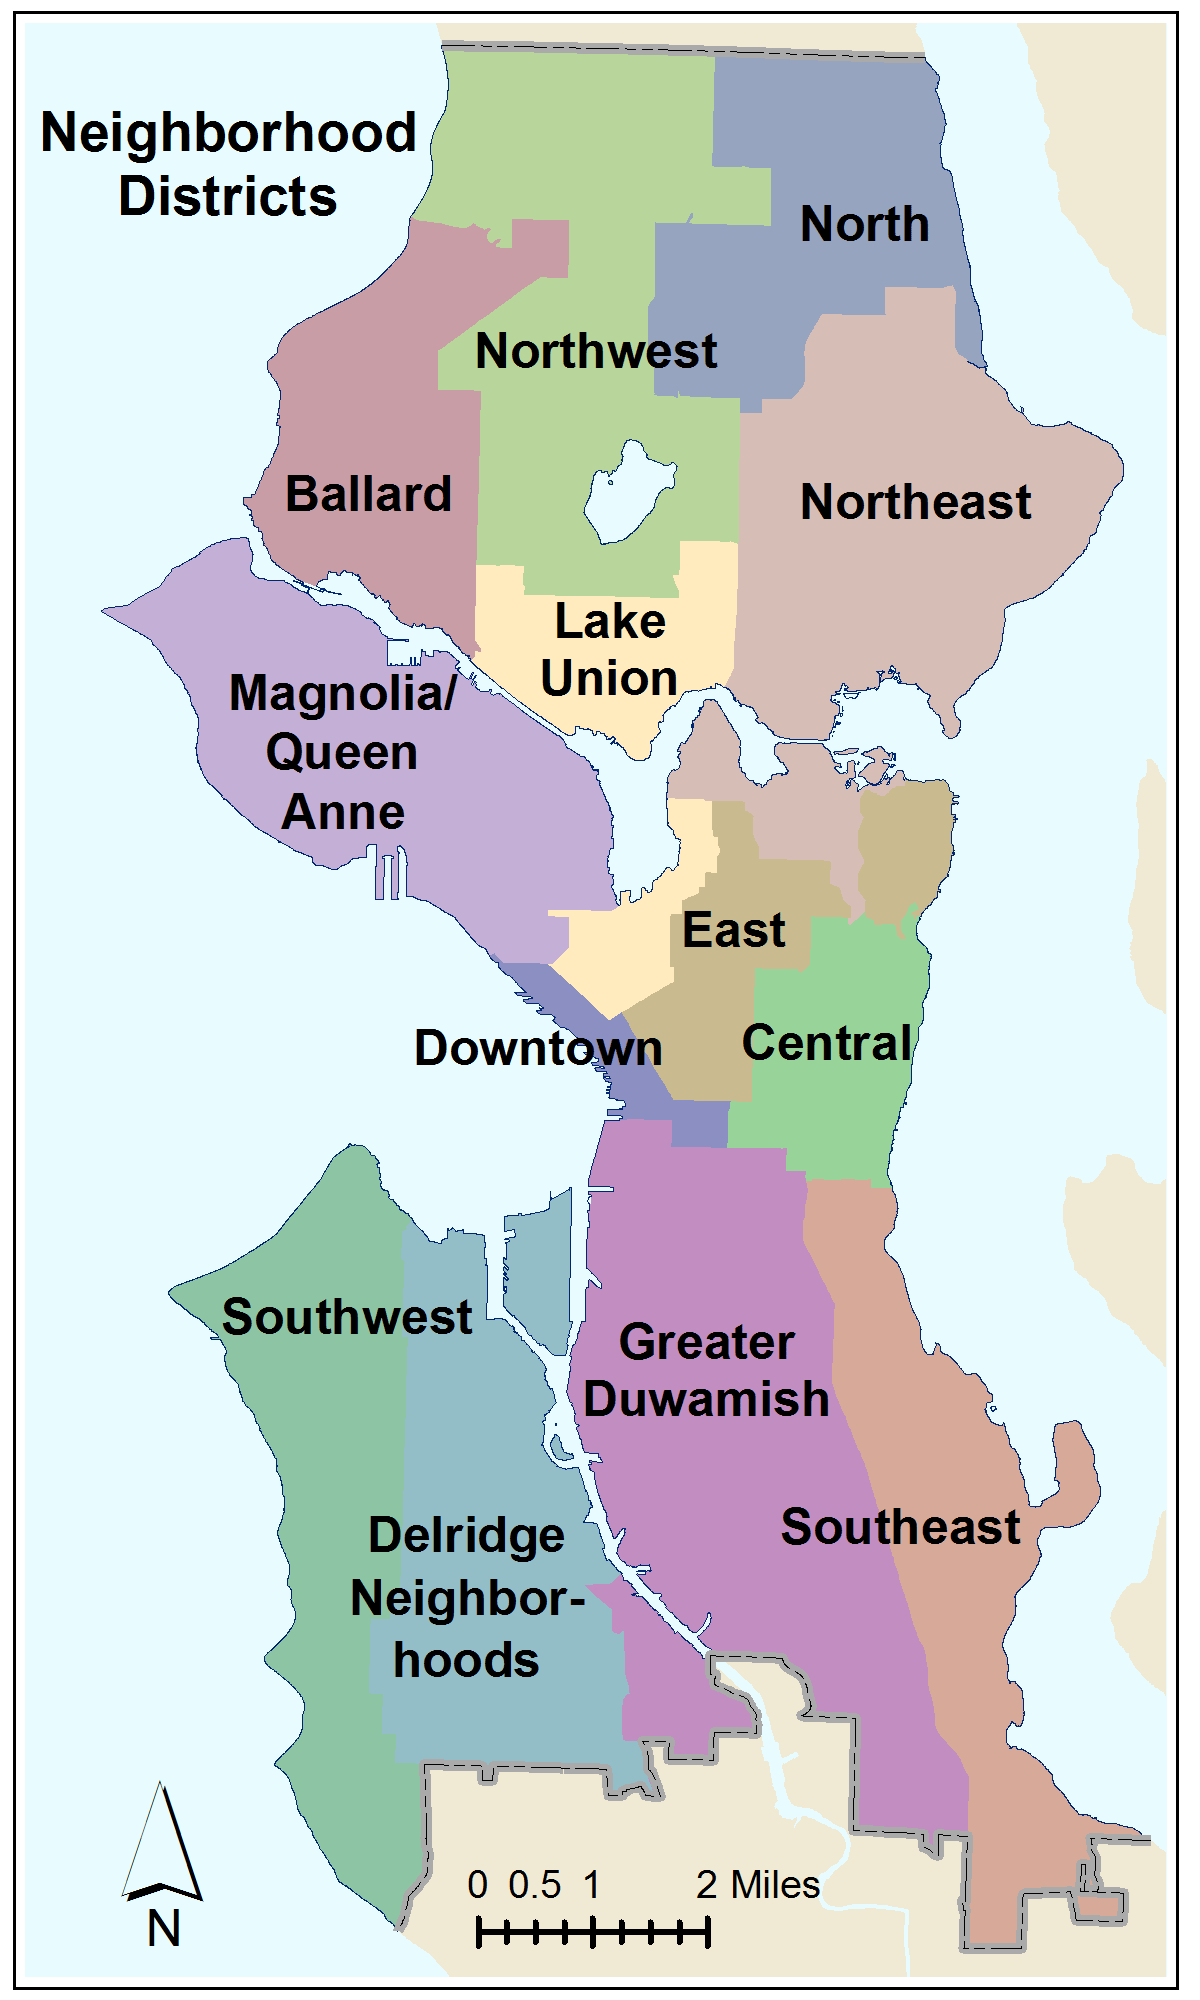
Neighborhood Districts
The Community Reporting Areas have been grouped into 13 Neighborhood Districts to approximate the Neighborhood Districts represented on the City Neighborhood Council.
- Census 2010 Census Tracts and Neighborhood Districts Reference Map
- Census 2010 Neighborhood Districts Change from 1990-2010
- Census 2010 Neighborhood Districts Change from 1990
- Census 2010 Neighborhood Districts Population Characteristics
- Census 2010 Neighborhood Districts Household Characteristics
- Census 2010 Neighborhood Districts Housing Characteristics
- Subject report – (Population, Households, Housing)
- Census 2010 Neighborhood Districts Subject Report
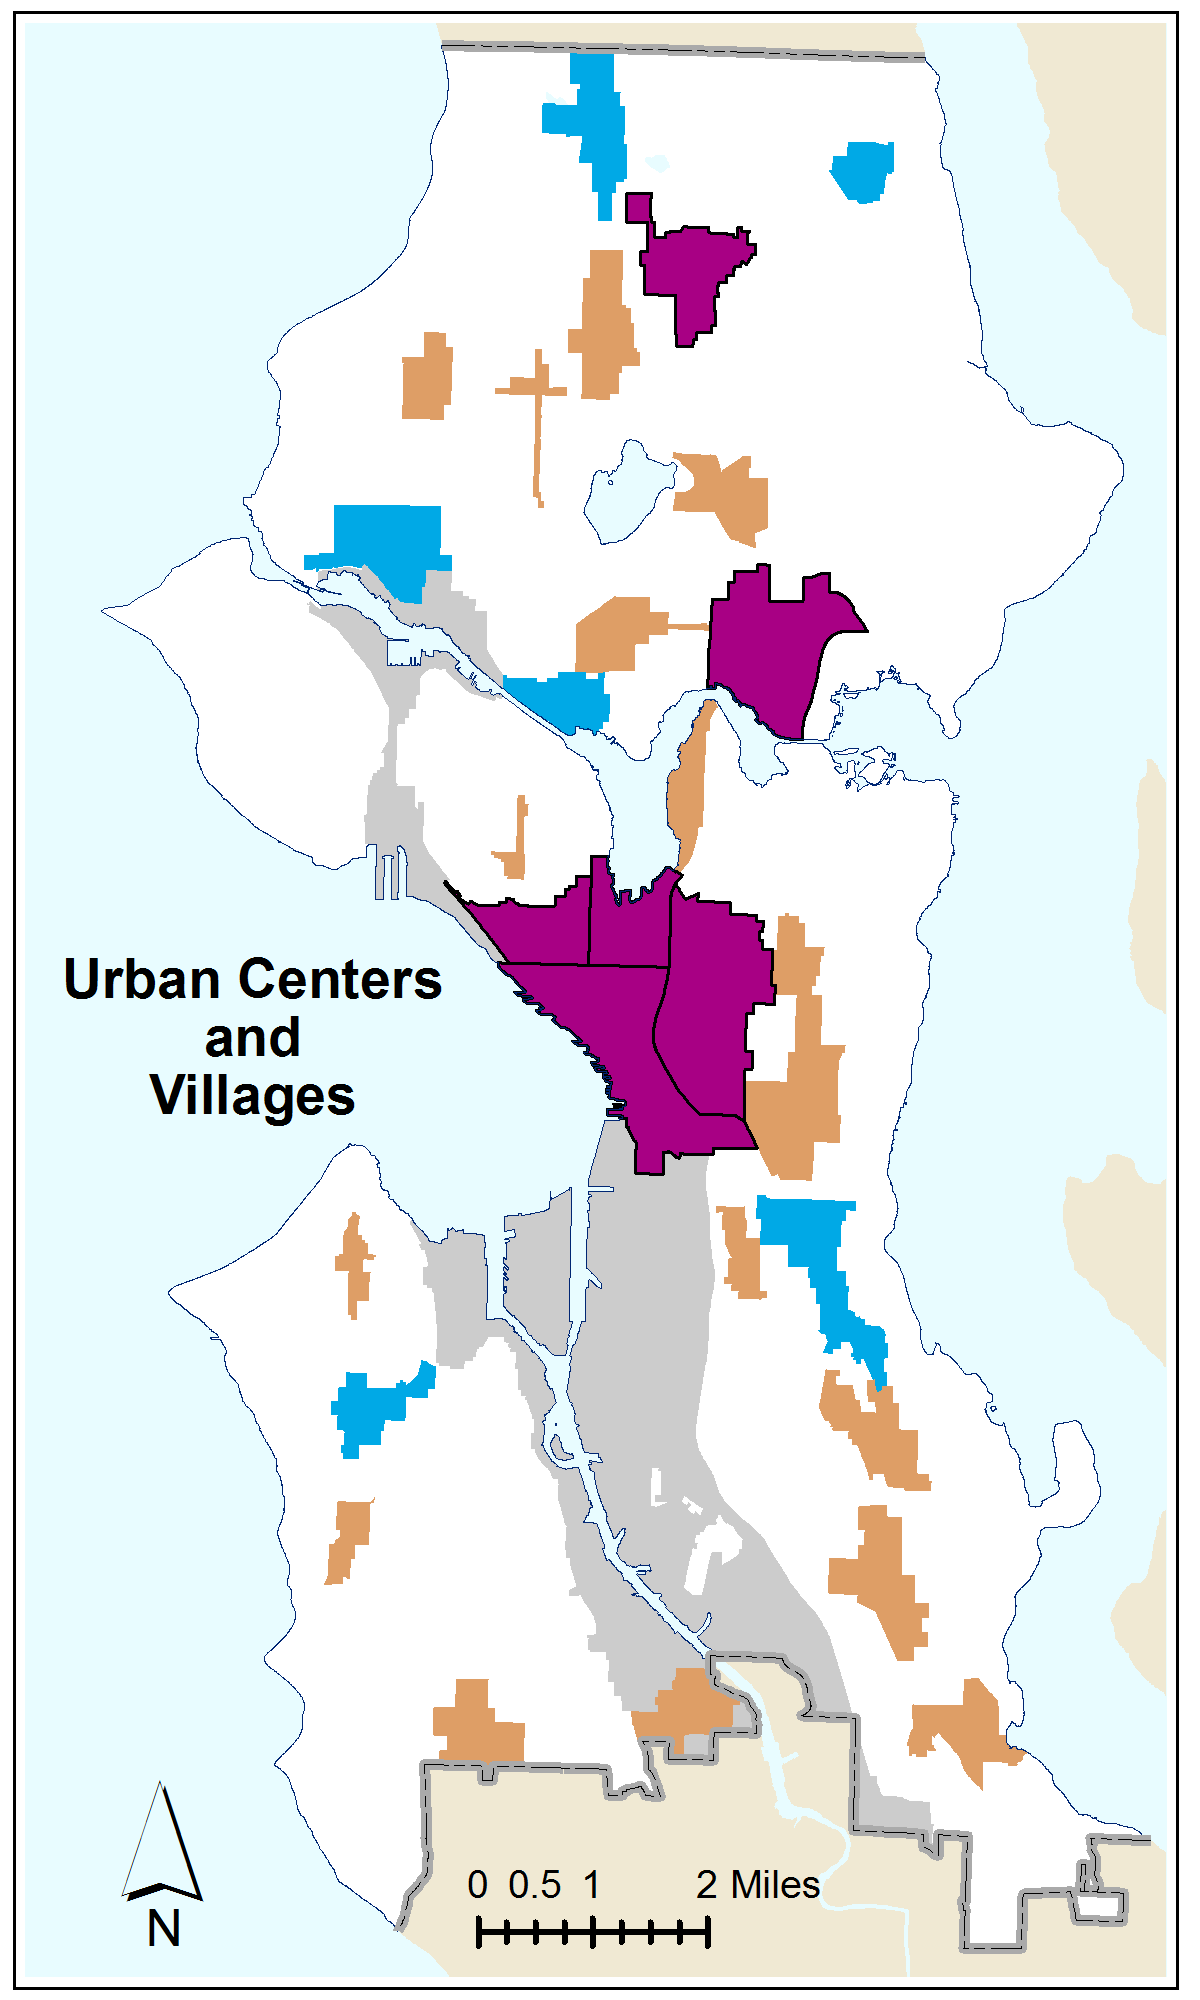
Urban Centers and Villages
Urban Centers and Villages are areas designated in Seattle's Comprehensive Plan to accommodate future population and job growth.
- 2010 Census Tracts and Urban Centers and Villages Reference Map
- Census 2010 Urban Centers and Villages Change from 1990-2010
- Census 2010 Urban Centers and Villages Change from 1990
- Census 2010 Urban Centers and Villages Population Characteristics
- Census 2010 Urban Centers and Villages Household Characteristics
- Census 2010 Urban Centers and Villages Housing Characteristics
- Census 2010 UrbanCenters and Villages Subject Report report (Population, Households, Housing)
- Census 2010 UrbanCenters and Villages Subject Report
Technical Documentation
More Information
For a description of the full range of available decennial Census data products, visit the Census Bureau’s 2010 Census Data Product Descriptions.
For geographic reference files, maps, and GIS shapefiles of census geographies please see Geographic Files and Maps.
For a more detailed discussion of the differences in the way questions were asked in the 2000 and 2010 censuses as well as geographic changes that may affect comparability between decennial censuses please see the Data Issues tab at the top of this page.
2000 Census
The 2000 decennial census was composed of the 100% count “short-form” sent to all households and the sample “long-form” sent to a sample of households. Summary File 1 is the 100% data that corresponds to a limited number of questions asked of every person and housing unit in the United States. These questions included sex, age, household relationship, race and Hispanic origin, and ownership versus rental status.
Sample characteristics Summary File 3 data provides additional information on a sample of persons and housing units. These questions included social and economic characteristics of the population, and physical and financial characteristics of housing units. Approximately one in six households nationwide received the long form.
Demographic Highlights
Population Size & Growth
In 2000, with 563,374 people, Seattle surpassed its previous population high of 557,087 in the 1960 Census. Seattle ranked 24th in size among U.S. cities.
Growth rate doubled from 1980s.
Between 1990 and 2000, Seattle grew by about 47,000 people, or 9 percent. That rate is twice as fast as the city’s growth between 1980 and 1990 and close to the national increase of 10 percent growth in central cities in 2000.
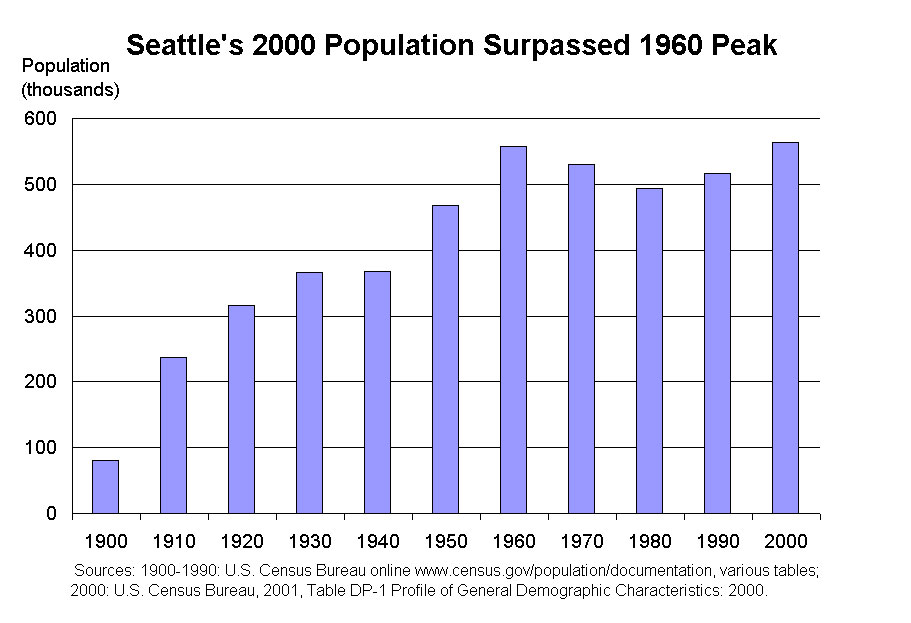
2000 population caped 20-year growth spurt.
The 2000 growth rate continued a trend since the 1980 census, which reversed a period of population loss. From 1960 to 1980 Seattle's population declined 11 percent.
City grew faster than Seattle's Comprehensive Plan target.
Seattle's Comprehensive Plan set out to accommodate a population growth of 72,000 between 1994 and 2014. Our estimated growth from 1994 to 2000 reached 45 percent of that projected increase.
Census found higher growth than forecasted.
When our comprehensive plan was adopted, an independent economic forecast said Seattle would have 536,000 people in 2000. Estimates by Washington state and the City of Seattle had anticipated the city’s 2000 population to be between 540,000 and 548,000. The 2000 census found more people in Seattle than had been projected.
Suburbs grew faster than Seattle.
Between 1990 and 2000, Seattle's population growth represented 21 percent of the county's growth.
Seattle became smaller proportion of county.
Seattle's share of King County's population declined from 34 percent in 1990 to 32 percent in 2000. Our share of the county population has been steadily declining over the past four decades as population increases in the suburbs.
Seattle ranked 10th in relative growth in Washington state.
Seattle’s population change between 1990 and 2000, as a percentage (9 percent), was the smallest change among the 10 largest Washington cities.
Race
In 2000, 4.5 percent of Seattleites identified themselves as multiracial, which was almost twice the national average.
The US Census Bureau does not recommend comparing 2000 race data with that for 1990 if the percent identifying themselves as multiracial is this high. In previous censuses people were required to select only one race.
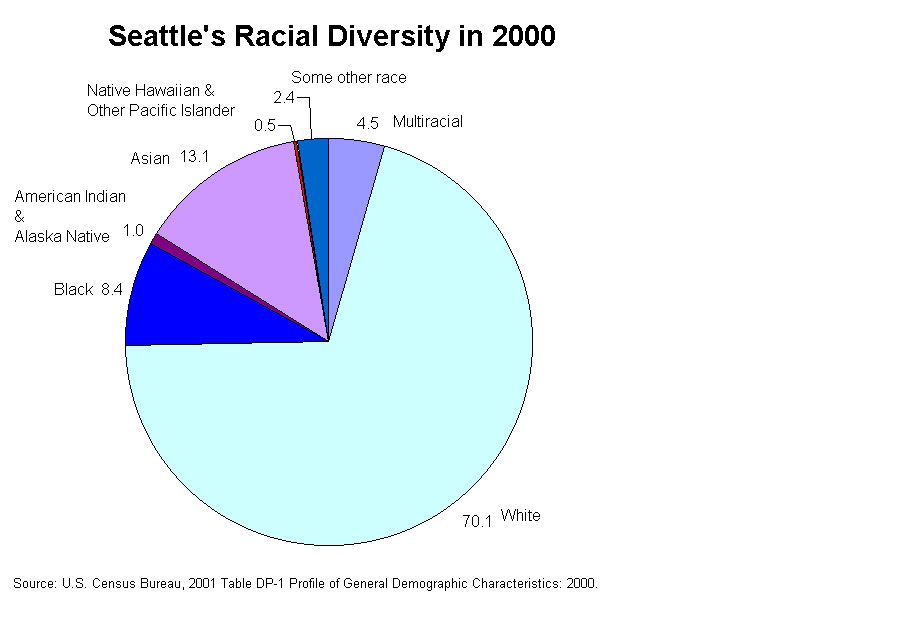
Nearly three quarters of Seattleites were white.
Seventy percent of Seattleites identified themselves as white in the 2000 Census. Another 3.3 percent identified themselves as white and another race.
People of Asian descent comprised Seattle's second largest racial group.
Thirteen percent of Seattleites self-identified as Asian in the 2000 census. Another 1.9 percent identified themselves as Asian and another race. Likewise, in King County 11 percent chose Asian as their race and another 1.7 chose Asian as well as another race to identify themselves. In Washington state a much smaller 5.5 percent identified themselves as Asian and an additional 1.2 percent listed Asian along with another race. In the United States 3.6 percent of the population is of Asian descent and another 0.6 percent of the population identified themselves as at least two races including Asian.
Chinese was larger than other groups of Asian origin in Seattle.
The largest group of Asian descent in Seattle was Chinese, followed by Filipino, Vietnamese, Japanese, Korean, and Asian Indian.
Seattle had lower percent of blacks than the United States.
Of Seattle's population 8.4 percent identified themselves as African American or black; another 1.4 percent selected black in combination with one or more other races. Only 5.4 percent of the King County population and 3.2 percent of Washington state residents identified themselves as black. Twelve percent of the United States population was black. People who chose black or African American as well as one or more other races to describe themselves accounted for another 1.1 percent of King County, 0.8 percent of Washington state, and 0.6 percent of the United States population.
Native American and Alaskan natives contribute to city's diversity.
One percent of Seattle’s 2000 population chose Native American or Alaska Native to describe themselves. Another 1.1 percent of the population chose Native American or Alaska Native as well as at least one other race.
Seattle's percent of Native Hawaiian and other Pacific Islanders was five times the national rate.
Of Seattle's 2000 population, 0.5 percent chose Native Hawaiian or other Pacific Islanders to identify themselves. Samoans formed the largest group, followed by Native Hawaiians and Guamanian or Chamorros. Another 0.4 percent of our population, nearly 5,000 people, chose Native Hawaiian or other Pacific Islander along with one or more other races. In the 2000 census, 2.4 percent of Seattleites chose the category "some other race."
Ethnicity
Hispanic presence lower in Seattle than in the United States and Washington state.
Seattle's population of Hispanic origin increased 62 percent between 1990 and 2000, higher than the national average for growth within this group. However, Hispanics represented only 5.3 percent of Seattle's total population, significantly less than the nation as a whole (13 percent). The percent of King County's population that was Hispanic was about the same as Seattle's –5.5 percent. In Washington state 7.5 percent of the population was of Hispanic origin. Hispanic or Latino is the only ethnicity reported by the Census. Hispanics can be of any race.
Census found the majority of the city's Hispanics have origins in Mexico.
Sixty percent of Seattle’s Hispanics were of Mexican origin. The next largest group were of Puerto Rican origin, followed by those of Cuban descent.
Age
The table below compares Seattle’s child and teen populations to those of King County, Washington state, and the United States.
|
Percentage of total population |
||||
|
Years of Age |
Seattle |
King County |
Washington State |
United States |
|
Less than 5 |
4.7 |
6.1 |
6.7 |
6.8 |
|
5 to 9 |
4.3 |
6.4 |
7.2 |
7.3 |
|
10 to 14 |
4.2 |
6.3 |
7.4 |
7.3 |
|
15 to 19 |
5.3 |
6.2 |
7.3 |
7.2 |
|
All ages < 20
|
18.5
|
25.0
|
28.6
|
28.6
|
|
Sources: Profiles of General Demographic Characteristics 2000 United States and Profiles of General Demographic Characteristics 2000 Washington, U.S. Census Bureau, May 2001 |
||||
Young children comprise a smaller percent of Seattle's population in 2000.
Even as the city's population grew by 9 percent between 1990 and 2000, the number of children under 5 years of age fell by 10 percent. In contrast, the number of children ages 5 to 9 rose 2.6 percent during the decade; those 10 to 14 increased by 17 percent; and teens 15 to 19 expanded by 16 percent. Overall, children and teens comprised about one (0.7) percent less of Seattle's population in 2000 than they did in 1990.
Age structure shifted since 1990.
In addition to youth becoming a slightly smaller percent of the population (declining from 19 to 18 percent), people in the age group 35 to 54 increased by 4 percent (from 27 to 31) and those 65 or older declined by 3 percent (from 15 to 12 percent). There was no change in the relative size of the groups made up of people ages 20 to 34 and 55 to 64.
King County, Washington state, and the United States had a higher proportion of children than Seattle.
Youth under 20 years old represented only 19 percent of Seattle's population compared to 25 percent of King County and 29 percent for both Washington state and the United States. All four five-year age groups under age 20 show the same pattern between Seattle and larger jurisdictions; Seattle has the lowest proportion of children.
Seattle had a higher proportion of young adults than the county, state, or United States.
Young adults ages 20 to 34, on the other hand, comprised a much larger percent of Seattle's population (31 percent) than they did of King County's (24 percent) or of Washington state's and the United States' (both at 21 percent).
Three age groups were similar for Seattle, county, state, and the United States.
The proportion of the population ages 35 to 54 was nearly identical across all four levels of geography. This age group made up 31 percent of Seattle, 33 percent of King County, 31 percent of Washington state, and 29 percent of the United States. Similarly, those ages 55 to 64 formed about the same proportion of each population: 7 percent of Seattle's population; 8 percent of both King County's and Washington state's populations; and 9 percent of the United States' population. Twelve percent of Seattle's population was 65 or older – the same proportion as for the nation. Eleven percent of the populations of King County and Washington state were 65 or older.
Seattle is above the county, state, and nation in proportion of population over age 85.
However, the percent of people in Seattle ages 85 and older (2.0 percent) was one-third higher than it was for the total U.S. population (1.5 percent). For King County and the state of Washington 1.4 percent of the population was age 85 or older.
The Census and Seattle's Housing Goals
Washington state's Growth Management Act directs cities to accommodate population growth through a comprehensive plan. The state forecasts population growth at the county level. Each jurisdiction within each county allocate that growth among the cities and unincorporated areas based on past trends and policy goals. Seattle, like all cities in King County, used households in its comprehensive plan, rather than population. Housing units are more reliable measure of growth than population estimates for the years between census counts. Also, our land use regulations directly affect the number of housing units that can be built.
Seattle's steady household size defied the long-term trend.
Seattle's Comprehensive Plan included the goal of accommodating 50,000 to 60,000 additional households, an increase of 19 to 23 percent, between 1994 and 2014. We based that goal on the need to accommodate a growing population with the assumption that Seattle's average household size would continue its historical decline and drop to 2.03 by 2000. Graph 1 shows the decline in household size from 2.7 in 1960 to 2.1 in 1990. The 2000 census found that the average household size for the city had in fact declined only slightly over the decade (from 2.09 in 1990 to 2.08 in 2000). The larger than expected household size recorded in the 2000 census meant that fewer housing units were needed to accommodate population growth.

Housing growth matches population growth.
The number of housing units in Seattle increased about 9 percent (21,492 units) during the 1990s to reach 270,524 units, according to Census 2000. Seattle's population also grew 9 percent over the decade. In 1994, the state estimated Seattle had approximately 259,000 housing units; the city's growth from 1994 to 2000 was nearly 4.5 percent, or about one-fifth of Seattle's 20-year goal. Seattle's Comprehensive Plan did not assume that the growth in population or housing units would be distributed evenly over the 20 years. The forecasts in the plan showed that both household and population growth would be relatively slow in the mid-1990s. The growth rates were then forecast to gradually increase until 2001.
The 2000 census indicated that the number of households in Seattle grew slightly more by 2000 than anticipated in our comprehensive plan. However, because the average household size did not decline as much as was expected, Seattle had about 15,0000 more people by 2000 than our comprehensive plan had forecasted.
Household Characteristics
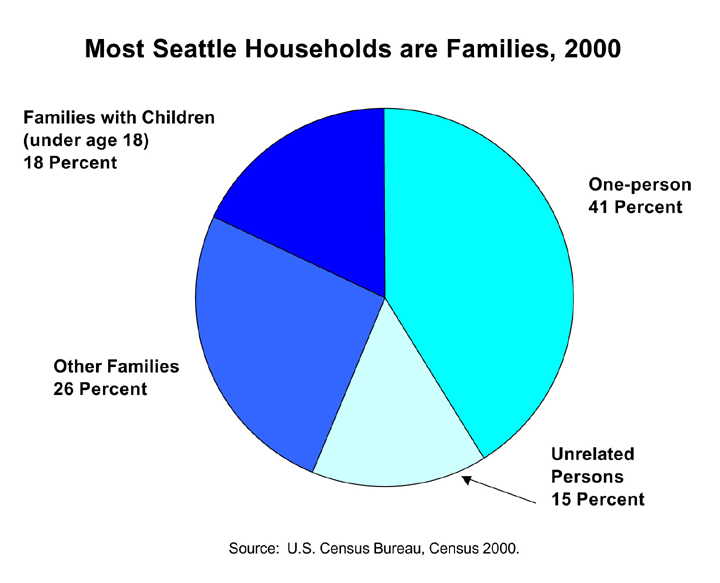
Most Seattleites live in families.
The majority of Seattleites (58 percent) live in family households as defined by the U.S. Census Bureau (see Graph 1). Family households are those where the head of the household is related to one or more others in the home by blood, adoption, or marriage.
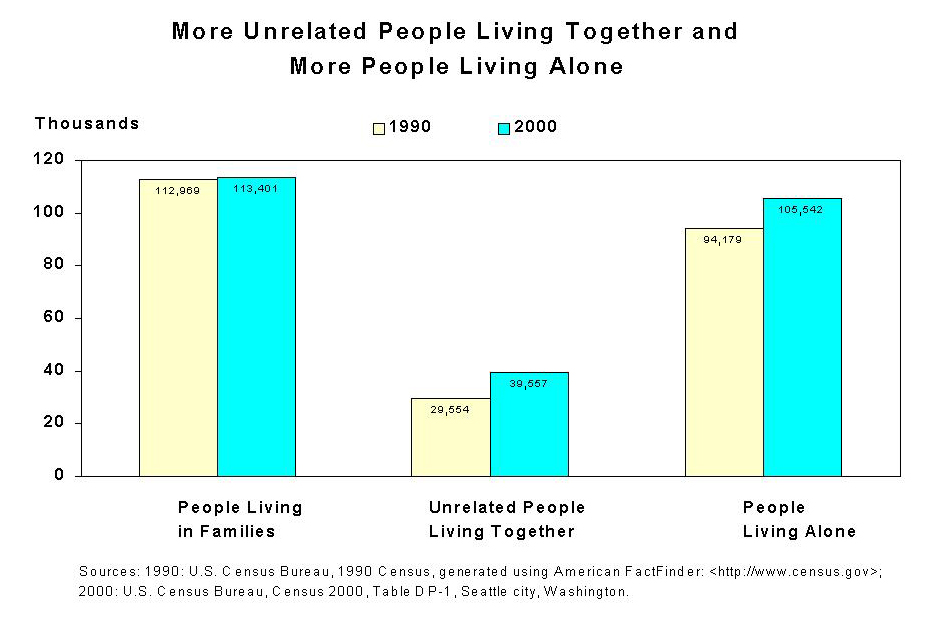
Family households grew at a slower rate than other types of households.
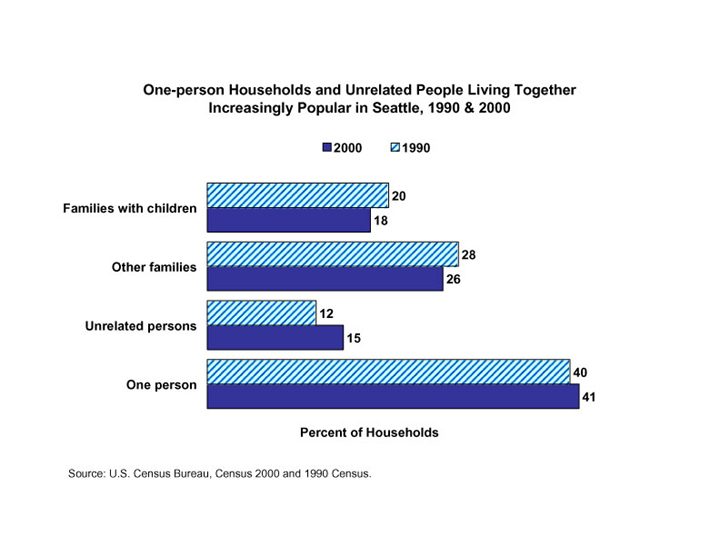
Graph 2 shows the shares of Seattle households that were families (with and without children), unrelated people who lived together, and people who lived alone in 2000. Families made up the largest group at 44 percent of Seattle's households. While the number of families in Seattle grew during the decade, their share of total households is declining (see Graph 3). Other types of households have grown much faster: those comprised of unrelated persons grew by one-third and single-person households by 12 percent, while family households grew less than one percent over the decade.
One-person households contributed the most growth to the number of Seattle households.
The number of one-person households increased by over 11,000 between 1990 and 2000, accounting for 52 percent of Seattle's new households over the decade. Households of unrelated individuals contributed 46 percent of the growth in Seattle households. Families contributed 2 percent of Seattle's household growth between 1990 and 2000.
Fewer of Seattle households are families than in King County, Washington state, or the nation.
Families were a lower percent of Seattle households than they were in King County, Washington state, and the United States (see Table 1). Forty-four percent of Seattle's households were a family compared to 59 percent of King County households overall and 68 percent of King County households minus Seattle. In Washington state and the United States, 66 percent and 68 percent of households were families, respectively.
|
Table 1: Household Composition in Seattle, King County, Washington State, and the United States |
||||
|
Percent of Households |
Seattle |
King |
Washington State |
United |
|
Comprised of Families* |
44 |
59 |
66 |
68 |
|
Include a Married Couple |
33 |
46 |
52 |
52 |
|
Include a Person Under Age 18 |
20 |
30 |
35 |
36 |
|
Include a Person Age 65 or Older |
19 |
18 |
20 |
23 |
|
Comprised of One Person |
41 |
31 |
26 |
26 |
|
Comprised of One Person, Age 65 or Older |
9 |
8 |
8 |
9 |
|
Comprised of Unrelated People |
15 |
10 |
8 |
6 |
|
SOURCE: U.S. Census Bureau, 2000, Table DP-1, Profile of General Demographic Characteristics: 2000. * Family households are comprised of two or more people who are related by blood, adoption, or marriage. |
||||
Seattle households are less likely to include children than are those in the county, state, and nation.
Twenty percent of Seattle households included someone under 18 years of age. The corresponding numbers in King County was 30 percent (37 percent excluding Seattle households), 35 percent in Washington state, and 36 percent in the United States. Of the 12 cities shown in Table 2, only San Francisco had a lower proportion with children.
|
Table 2: Household Composition in Seattle, Other Washington Cities, and Selected U.S. Cities |
||||||
|
PERCENT OF HOUSEHOLDS: |
||||||
|
Families* |
Unrelated People |
One Person: |
Include Person of Age: |
|||
|
Any age |
Age 65 or over |
17 or under |
65 or over |
|||
|
WASHINGTON STATE CITIES |
||||||
|
Bellevue |
63 |
8 |
28 |
28 |
29 |
22 |
|
Seattle |
44 |
15 |
41 |
23 |
20 |
19 |
|
Spokane |
58 |
8 |
34 |
34 |
32 |
23 |
|
Tacoma |
60 |
8 |
32 |
33 |
34 |
22 |
|
Vancouver |
64 |
8 |
28 |
30 |
36 |
19 |
|
OTHER SELECTED CITIES: |
||||||
|
Austin, Texas |
53 |
14 |
33 |
14 |
30 |
12 |
|
Boston, Mass. |
48 |
15 |
37 |
25 |
26 |
19 |
|
Charlotte, N.C. |
61 |
9 |
30 |
21 |
34 |
16 |
|
Cleveland, Ohio |
59 |
6 |
35 |
32 |
35 |
24 |
|
Denver, Colo. |
50 |
11 |
39 |
24 |
26 |
19 |
|
Kansas City, Mo. |
58 |
8 |
34 |
28 |
32 |
21 |
|
Memphis, Tenn. |
63 |
8 |
34 |
29 |
35 |
21 |
|
Minneapolis-Saint Paul, Minn. |
49 |
12 |
39 |
22 |
28 |
17 |
|
Oklahoma City, Okla. |
63 |
6 |
31 |
29 |
34 |
20 |
|
Portland, Ore. |
53 |
12 |
35 |
26 |
27 |
20 |
|
San Francisco, Calif. |
44 |
17 |
39 |
25 |
19 |
24 |
|
Tucson, Ariz. |
58 |
9 |
32 |
29 |
33 |
22 |
|
NOTE: The first three columns may not add to 100 due to rounding. * Family households are comprised of two or more people who are related by blood, adoption, or marriage. |
||||||
Seattle's average family size was steady.
The average family size for Seattle increased by 1 percent from 2.84 persons per family in 1990 to 2.87 in 2000. Families in King County were larger than families in Seattle; they averaged 3.03 persons. If Seattle families were excluded from King County, the average-size family in the county had 3.09 persons. The average family size in Washington state was 3.07 and the average size in the United States was 3.14.
Seattle stood apart from other cities in household composition.
About twice as many Seattle households were comprised of unrelated individuals than was the case in the other Washington cities with population above 100,000: Bellevue, Spokane, Tacoma, and Vancouver (see Table 2). Also, Seattle households were more likely than those in King County, Washington state, or the United States to be made of unrelated people (see Table 1). Fifteen percent of Boston households and 17 percent of San Francisco households were of this type. The other U.S. cities shown on Table 2 each had a lower proportion ranging from 6 percent in Cleveland and Oklahoma City to 14 percent in Austin.
Family households were more prevalent in Washington's other cities with a population over 100,000.
Bellevue, Spokane, Tacoma, and Vancouver, Washington all had a higher share of family households than Seattle, according to Census 2000. Family households were also more common in the other cities shown on Table 2, with the exception of San Francisco where, like Seattle, 44 percent of households are families.
Other Washington cities had a higher percentage of households with youth.
One in five Seattle households included someone under age 18 compared to 29 percent in Bellevue, 32 percent in Spokane, 34 percent in Tacoma, and 36 percent in Vancouver, Washington. Among the other cities shown on Table 2 only San Francisco had a lower percent of households (19 percent) with youth under age 18 than Seattle.
Seattle's average household size was relatively small.
Owner-occupied households in Seattle are smaller, on average, than those in Bellevue, Spokane, Tacoma, and Vancouver, Washington and King County, Washington state, or the United States, overall. At 2.32 people, Seattle's average household size for owner-occupied homes was smaller than that for any of the cities shown on Table 3 which range from a low of 2.41 in Denver to 2.73 in San Francisco. Seattle's average household size for renter-occupied homes was also smaller than are those for King County, Washington State, the U.S. and all of the cities shown here.
|
Table 3: Housing Tenure and Average Household Size in Seattle, King County, Washington State, United States, Other Washington Cities, and Selected U.S. Cities |
||||
|
Occupied Housing Units |
Avg. Household Size |
|||
|
Owner-occupied |
Renter- |
Owner-occupied |
Renter-occupied |
|
|
Seattle |
48 |
52 |
2.32 |
1.84 |
|
King County |
60 |
40 |
2.60 |
2.08 |
|
Washington State |
65 |
35 |
2.65 |
2.32 |
|
United States |
66 |
34 |
2.69 |
2.40 |
|
OTHER WASHINGTON CITIES |
||||
|
Bellevue |
62 |
39 |
2.54 |
2.10 |
|
Spokane |
59 |
41 |
2.47 |
2.11 |
|
Tacoma |
55 |
45 |
2.60 |
2.27 |
|
Vancouver |
53 |
47 |
2.57 |
2.42 |
|
SELECTED CITIES |
||||
|
Austin, Texas |
45 |
55 |
2.65 |
2.19 |
|
Boston, Mass. |
32 |
68 |
2.51 |
2.22 |
|
Charlotte, N.C. |
58 |
43 |
2.56 |
2.30 |
|
Cleveland, Ohio |
49 |
52 |
2.56 |
2.32 |
|
Denver, Colo. |
53 |
48 |
2.41 |
2.10 |
|
Kansas City, Mo. |
58 |
42 |
2.52 |
2.11 |
|
Memphis, Tenn. |
56 |
44 |
2.62 |
2.40 |
|
Minneapolis-Saint Paul, Minn. |
53 |
47 |
2.55 |
2.09 |
|
Oklahoma City, Okla. |
59 |
41 |
2.51 |
2.27 |
|
Portland, Ore. |
56 |
44 |
2.47 |
2.08 |
|
San Francisco, Calif. |
35 |
65 |
2.73 |
2.06 |
|
Tucson, Ariz. |
53 |
47 |
2.58 |
2.24 |
|
NOTE: The first two columns may not round to 100 due to rounding error. SOURCE: U.S. Census Bureau, 2001, Table DP-1. Profile of General Demographic Characteristics: 2000. |
||||
Living Alone in Seattle
Living alone in Seattle almost as likely as living in a family.
Seattle was unusual for its high proportion of one-person households. This type of household was more common in Seattle than it was in the county, state, or in the nation. Two of every five Seattle households is home to just one person – 41 percent, up slightly from 40 percent in 1990.
In King County, 31 percent of households were comprised of one person (25 percent if Seattle households are excluded) and 26 percent of households in both Washington state and the United States overall were one-person homes.
Living alone was more popular in Seattle than other Washington cities and selected United States cities of similar size.
Two of five Seattle households were comprised of just one person. The percent of one-person households in the other four Washington cities with populations over 100,000 ranged from 28 percent in Bellevue and Vancouver to 34 percent in Tacoma. None of the other United States cities shown in the table below had as high a percent of one-person households as Seattle's 41 percent. The 12 cities ranged from a low of 30 percent in Charlotte, North Carolina to 39 percent in Denver and San Francisco.
|
Table 4: Household Composition in Seattle, Other Washington, and Selected U.S. Cities |
||||||
|
Percent of Households: |
||||||
|
Families* |
Unrelated People |
One Person |
Include Person of Age |
|||
|
Any age |
Age 65 or over |
17 or under |
65 or over |
|||
|
WASHINGTON STATE |
||||||
|
Bellevue |
63 |
8 |
28 |
28 |
29 |
22 |
|
Seattle |
44 |
15 |
41 |
23 |
20 |
19 |
|
Spokane |
58 |
8 |
34 |
34 |
32 |
23 |
|
Tacoma |
60 |
8 |
32 |
33 |
34 |
22 |
|
Vancouver |
64 |
8 |
28 |
30 |
36 |
19 |
|
SELECTED CITIES |
||||||
|
Austin, Texas |
53 |
14 |
33 |
14 |
30 |
12 |
|
Boston, Mass. |
48 |
15 |
37 |
25 |
26 |
19 |
|
Charlotte, N.C. |
61 |
9 |
30 |
21 |
34 |
16 |
|
Cleveland, Ohio |
59 |
6 |
35 |
32 |
35 |
24 |
|
Denver, Colo. |
50 |
11 |
39 |
24 |
26 |
19 |
|
Kansas City, Mo. |
58 |
8 |
34 |
28 |
32 |
21 |
|
Memphis, Tenn. |
63 |
8 |
34 |
29 |
35 |
21 |
|
Minneapolis-Saint Paul, Minn. |
49 |
12 |
39 |
22 |
28 |
17 |
|
Oklahoma City, Okla. |
63 |
6 |
31 |
29 |
34 |
20 |
|
Portland, Ore. |
53 |
12 |
35 |
26 |
27 |
20 |
|
San Francisco, Calif. |
44 |
17 |
39 |
25 |
19 |
24 |
|
Tucson, Ariz. |
58 |
9 |
32 |
29 |
33 |
22 |
|
NOTE: The first three columns may not add to 100 due to rounding. * Family households are comprised of two or more people who are related by blood, adoption, or marriage. |
||||||
Nearly one-quarter of Seattle's one-person households was home to seniors.
People age 65 or over comprised 23 percent of Seattle's one-person households. In King County overall, 25 percent of one-person households were home to seniors (26 percent if Seattle is excluded). Seniors made up 31 percent of one-person households in Washington state and 36 percent of one-person households in the United States.
In Bellevue, Spokane, Tacoma, and Vancouver, Washington, the proportions of one-person households that were people age 65 or older were higher, ranging from 28 percent to 34 percent. Of the other 12 United States cities shown in table 4, only three had a lower percent of one-person households occupied by seniors than Seattle. In Austin, just 14 percent of one-person households were seniors; however, Charlotte, North Carolina and Minneapolis-Saint Paul were similar to Seattle with 21 and 22 percent respectively.
Seniors in Seattle were more likely to live on their own.
In Seattle people age 65 or older were more likely to live alone than those residing in the rest of King County, Washington state, and the United States. In Seattle, just over one-third of the people age 65 or over lived on their own. In 2000, seniors in Seattle were equally likely to live alone as they were in 1990 (35 percent). In King County, 29 percent of those 65 or older lived alone; in King County apart from Seattle, 26 percent lived alone. In Washington state and the United States 28 percent in this age group lived alone.
Three of the cities compared here had slightly higher proportions of seniors living alone than Seattle: Boston, Denver, and Minneapolis-Saint Paul. All were within two percentage points of Seattle's 35 percent.
Home Ownership in Seattle
Seattleites were more likely to live in their own homes than rent.
In Seattle, 54 percent of those who lived in housing units (that is, not in group quarters) lived in homes that either they or someone in their household owned. The other 46 percent of this population lived in a home that is rented.
Homeowners and renters occupied nearly equal proportions of housing units.
Fifty-two percent of occupied housing units were renter-occupied and homeowners lived in the remaining 48 percent. Because the average household size for owner-occupied housing units was 2.32 persons compared to 1.84 people in renter-occupied units, owner-occupied housing units have a larger number of people on average. Homeownership declined slightly from 49 percent of households in 1990 to 48 percent in 2000. The average-size household in 1990 had 2.09 persons; in 2000 the average was 2.08 persons. While the average size of rental households remained stable since 1990 at 1.84 people, owner-occupied units declined in size from an average of 2.35 persons in 1990 to 2.32 persons per unit in 2000.
Seattle's homeownership rate was low for Washington but less unusual among other United States cities.
While owners lived in close to half of all occupied housing units in Seattle, 60 percent of occupied housing units were owner-occupied in King County (66 percent when Seattle is excluded) as shown in the table below. In Washington state overall, 65 percent of occupied housing units were owner-occupied. Homeownership rates in the other four Washington cities shown here, Bellevue, Spokane, Tacoma, and Vancouver, were higher than Seattle, ranging from 53 percent to 62 percent.
Seattle's home-ownership rate was higher than three of the other United States cities shown below – Austin, Boston, and San Francisco. Seattle's rate was just 3 percentage points higher than Austin's but 16 percentage points higher than Boston's rate and 13 percentage points higher than San Francisco's. The homeownership rates for the other cities ranged from 1 to 10 percentage points higher than Seattle's rate (see table below). Nationwide, 66 percent of occupied housing units were owner-occupied.
|
Table 5: Housing Tenure and Average Household Size in Seattle, |
||||
|
Occupied Housing Units |
Average Household Size |
|||
|
Owner-occupied (percent) |
Renter-occupied (percent) |
Owner-occupied units |
Renter-occupied units |
|
|
Seattle |
48 |
52 |
2.32 |
1.84 |
|
King County |
60 |
40 |
2.60 |
2.08 |
|
Washington State |
65 |
35 |
2.65 |
2.32 |
|
United States |
66 |
34 |
2.69 |
2.40 |
|
OTHER WASHINGTON CITIES |
||||
|
Bellevue |
62 |
39 |
2.54 |
2.10 |
|
Spokane |
59 |
41 |
2.47 |
2.11 |
|
Tacoma |
55 |
45 |
2.60 |
2.27 |
|
Vancouver |
53 |
47 |
2.57 |
2.42 |
|
SELECTED CITIES |
||||
|
Austin, Texas |
45 |
55 |
2.65 |
2.19 |
|
Boston, Mass. |
32 |
68 |
2.51 |
2.22 |
|
Charlotte, N.C. |
58 |
43 |
2.56 |
2.30 |
|
Cleveland, Ohio |
49 |
52 |
2.56 |
2.32 |
|
Denver, Colo. |
53 |
48 |
2.41 |
2.10 |
|
Kansas City, Mo. |
58 |
42 |
2.52 |
2.11 |
|
Memphis, Tenn. |
56 |
44 |
2.62 |
2.40 |
|
Minneapolis-Saint Paul, Minn. |
53 |
47 |
2.55 |
2.09 |
|
Oklahoma City, Okla. |
59 |
41 |
2.51 |
2.27 |
|
Portland, Ore. |
56 |
44 |
2.47 |
2.08 |
|
San Francisco, Calif. |
35 |
65 |
2.73 |
2.06 |
|
Tucson, Ariz. |
53 |
47 |
2.58 |
2.24 |
|
NOTE: The first two columns may not round to 100 due to rounding error. SOURCE: U.S. Census Bureau, 2001, Table DP-1. Profile of General Demographic Characteristics: 2000. |
||||
Vacancy Rates
Low vacancy rate confirmed by census.
Census 2000 determined that there were 270,524 housing units in Seattle in 2000; 96 percent were occupied. Subtracting about 12,000 units that are for seasonal, recreational, or occasional use, the homeowner vacancy rate was 1.2 percent and the vacancy rate for rental units was 3.5 percent.
General Demographic Data
Reports and tables on basic population characteristics gathered from the census short-form 100% count, which is sent to all U.S. residences. Data is available from the U.S. Census Bureau at multiple geographic summary levels down to the block level.
Washington State Population, Housing, Household, and Group Quarters, including counties, cities, towns, & other geographic areas (617 pages)
Puget Sound Region Population, Race, and Housing, including counties, cities, towns, and census tracts (66 pages)
City of Seattle and 12 Sub-Areas
- Population, Housing, Household & Group Quarters - PDF file | Excel file
- Race - PDF file | Excel file
- Ethnicity (Hispanic or Latino) - PDF file | Excel file
- Detailed Group Quarters Population - PDF file | Excel file
Census Tracts in the City of Seattle
- Demographic Profile: Population, Race, Housing, Household & Group Quarters (378 pages)
- Population, Housing, Household & Group Quarters - PDF file | Excel file
- Race - PDF file | Excel file
- Ethnicity (Hispanic or Latino) - PDF file | Excel file
- Race, Ethnicity, Sex and Age - PDF file | Excel file
- Household, Group Quarters, and Housing Unit Tenure - PDF file | Excel file
- Detailed Group Quarters Population - PDF file | Excel file
Detailed Demographic Data
Reports and tables on detailed demographic data collected from the long-form sample sent to a sample of people and housing units nationwide. These data are weighted to represent the total population. Data are also included on the same topics covered on the short form of the census including age, sex, race and ethnicity. Data is available from the U.S. Census Bureau at multiple geographic summary levels down to the block group level.
City of Seattle
- Four-page profile - PDF file | Excel file
- Ten-page profile - PDF file | Excel file
- 58-page profile - PDF file
Census Tracts in the four-county Puget Sound Region
(Reports by the Puget Sound Regional Council)
- Age - PDF file | Excel file
- Commuting (“Journey to Work”) - PDF file | Excel file
- Disability - PDF file | Excel file
- Education - PDF file | Excel file
- Employment - PDF file | Excel file
- Housing - PDF file | Excel file
- Income - PDF file | Excel file
- Language - PDF file | Excel file
- Poverty - PDF file | Excel file
- Residency (“Migration”) - PDF file | Excel file
Neighborhood Areas
To report census data for these neighborhood areas, the City uses different combinations of census tracts, block groups and blocks to best approximate the various neighborhoods and sub-areas of the City. If the neighborhood-area boundaries split a block group or tract, the block group or tract was included if more than 50-percent of its population lived within the neighborhood area.
Community Reporting Areas
Community Reporting Areas (CRAs) were adopted in 2004 as a standard, consistent, citywide geography for reporting purposes. There are 53 CRAs derived from census tract geography.
- Reference Map
- Change from 1990-2010
- Race and Ethnicity
- Ten-Subject Profile (530 pages, 3.7MB)
Neighborhood Districts
The Community Reporting Areas have been grouped into 10 Neighborhood Districts to approximate the Neighborhood Districts represented on the City Neighborhood Council.
- Reference Map
- Change from 1990-2010
- Race and Ethnicity
- Ten-Subject Profile (140 pages, 2MB)
Urban Centers and Villages
Urban Centers and Villages are areas designated in Seattle's Comprehensive Plan to accommodate future population and job growth.
- Reference Map
- Change from 1990-2010
- Ten-Subject Profile (460 pages, 2.7MB)
Technical Documentation
More Information
For a description of the full range of available decennial Census data products visit the Census Bureau 2000 Census Data Gateway.
For geographic reference files, maps, and GIS shapefiles of census geographies please see Geographic Files and Maps.
For a more detailed discussion of the differences in the way questions were asked in the 1990 and 2000 censuses as well as geographic changes that may affect comparability between decennial censuses please see Data Issues tab at the top of this page.
A Century of Change: 1900-2000
- 1900-2000 Overview Table - includes population, land area, density, rank among U.S. cities, and percentage of population change by decade
1990 Decennial Census
General Demographic Data
The 1990 decennial census was composed of the 100% count “short-form” sent to all households and the sample “long-form” sent to a sample of households. Summary File 1 (SF1) is the 100% data that corresponds to a limited number of questions asked of every person and housing unit in the United States. These included sex, age, household relationship, race and Hispanic origin, and ownership versus rental status.
Detailed Demographic Data
Sample characteristics Summary File 3 (SF3) data provides additional information on a sample of persons and housing units. These included social and economic characteristics of the population, and physical and financial characteristics of housing units. Approximately one in six households nationwide received the long-form.
Neighborhood Areas
These reports and tables were developed by the City of Seattle.
- Seattle 1990: Who We Are (December 1992)
- Sub-Area Profiles, 1990 (February 1993) I Reference Map
More Information
For additional historic census data on Seattle or other parts of the country, visit the U.S. Census Bureau decennial census publications.
For a more detailed discussion of the differences in the way questions were asked in the 1990 and 2000 censuses, as well as geographic changes that may affect comparability between decennial censuses, please go to the Data Issues tab at the top of this page.
Subject Matter Comparability
Comparability With Different Decennial Censuses
2000 - 2010. The short-form questionnaire for the 2010 Census was very similar to the short-form questionnaire for the 2000 Census. Therefore, most data available from the 2010 Census can be reliably compared with the short-form data from the 2000 Census. There were some less substantial changes between the 2000 and 2010 censuses that may affect some analysis. Please see Details on Comparability of 2010 Census Data for more information on comparing 2010 Census data with short-form data from the 1990 and 2000 censuses.
1990 - 2000. Some substantial changes to the short-form were made for the 2000 Census which affects comparability with 1990 Census data.
The changes in 2000 include:
- Ethnicity asked before race (and identified as "Hispanic or Latino")
- Respondents could select one or more races
- Asian and Pacific Islander category split ("Asian" or "Native Hawaiian and Other Pacific Islander")
The allowance of multiple race responses makes it difficult to obtain direct comparability to 1990 and earlier censuses.
Comparability With the American Community Survey
The biggest change in subject matter for the 2010 Census is the lack of long-form questionnaire data. The traditional long-form questionnaire was eliminated in 2010 and has been replaced with the American Community Survey. This change presents a number of challenges. While the ACS provides data on a more frequent basis, the questions and time-frames are different. Therefore comparing the ACS data to the 2000 Census long-form data can be difficult. For more details, see the table-specific guidance from the Census Bureau on making comparisons using ACS data.
Geographic Comparability
When comparing data by a geographic area, please be aware that the Census Bureau redraws the geography every ten years based on physical changes such as new streets or a change in population. There were a number of changes in the census geography in Seattle for both the 2000 and 2010 Censuses. Please see Data Issues under Geographic Files and Maps.
Locally-Defined Neighborhoods
In order to report census data for neighborhood areas, we use different combinations of census tracts, block groups, and blocks to best approximate the various neighborhoods and sub-areas of Seattle. There are a few minor changes to the underlying blocks, block groups, and tracts in the 2010 geography that may affect the geographic area designated as a particular neighborhood. Changes observed in census data between decennial censuses may be affected by these changes in geography.
Changes in geography also affect comparing numbers from previously published reports to newer reports from the 2010 Census data. Neighborhood boundaries as well as the census geography that represent them change over time; previously published Census 2000 reports have not been updated to use consistent boundaries. Some changes in the data may be related to these geographic changes. Please refer to the provided neighborhood reference maps to identify significant changes in geography.
Derived Measures
The Census Bureau does not provide data or derived measures such as medians and averages for aggregations of census geography. Derived measures for these areas were estimated by the City of Seattle.